
Understanding Geographic and Projected Coordinate Systems
(and other GIS jargon)
One of the most common points of confusion for GIS users comes from understanding the differences between geographic coordinate systems and projected coordinate systems, as well as some of the other geodesy jargon often referenced in GIS. This article is intended to shed some light on the differences between the two and how they are applied, and to gain an understanding of some other commonly used terminology you hear in the world of GIS and geodesy.
In a nutshell, a Geographic Coordinate System (GCS) tells us where something is on the earth’s surface, and a Projected Coordinate System (PCS) tells us how to represent that something on a flat surface.
To understand the difference between the different types of geographic and projected coordinate systems we must first understand a little about the fundamentals of what these two systems are conveying and how they are doing it.
As any kindergartner will tell you, the earth is round. However, the earth is not perfectly round, it is a spheroid that is squished at the poles and swollen at the equator. This is referred to as an oblate spheroid. In fact, the radius of the planet when measured from the earth’s center to its surface is actually about 13 miles greater at the equator than it is at the poles. This deformation is largely due to rotational forces being applied to the planet and the plasticity of the earth. However, the planet isn’t even a perfect oblate spheroid, it’s lumpy and bumpy as a result of the earth’s mass not being evenly distributed, and thus gravitational forces being greater in areas with higher mass.
Ok, so the earth is a lumpy and bumpy oblate spheroid, so how do we accurately identify and convey an area on this bumpy oblate spheroid? To do that we need a grid system that can provide a specific set of values for every location on the earth, and for that that we need a spherical model to act as the basis for our grid system.
Reference Ellipsoid:
A reference ellipsoid is essentially a spherical model of the earth. Reference ellipsoids are 3-dimensional in shape and were mathematically created from a 2-D ellipse. Reference ellipsoids are primarily used as the surface-to-base coordinates (latitude/longitude, and elevation). There are a variety of reference ellipsoids and some ellipsoids are better suited for specific areas on the planet, or situations.
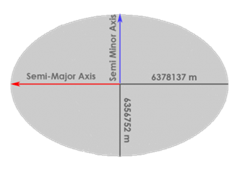
The major axis of this ellipsoid is the long axis and the minor axis is the shorter axis. As we know the earth is oblate in shape, making the horizontal width the major axis, and the vertical height the minor axis. The semi-major and semi-minor axes are half that of the major and minor axes. Therefore, the semi-major axis represents the distance from the earth’s center to the equator and the semiminor axis is from the earth’s center to the poles.
There are many different reference ellipsoids, but all are defined by their dimensions for semimajor and semiminor axes and the amount of flattening at the poles.
So, we have our reference ellipsoids, which provide us with a planetary shape. However, these ellipsoids are smooth and uniform and have slightly different shapes depending on the reference ellipsoid.
Therefore, a reference ellipsoid alone is not ideal for providing accurate measurements and cannot tell us where something on the planet is without more information. This is where datums are necessary.
Datums:
Datums define the position of the reference ellipsoid relative to the center of the earth and are the basis for providing a frame of reference for making measurements on the planet. To determine a global coordinate system, the center of the earth and the location of the north and south poles must be accurately determined. To do this, the accurate position of several locations around the earth must be determined. This is determined through a variety of measurement techniques but results in the x,y, and z geocentric coordinates for each location. Survey data from these markers provide information associated with the distance between these locations, and their relationship to celestial bodies (aka satellites).
A geodetic datum is used to anchor down an ellipsoid to a particular portion of the earth’s surface and uses real-world survey measurements to provide more accurate horizontal and vertical information.
Horizontal Datums
Traditionally, markers were often used in triangulation land surveying, which established a series of angles and distances between points and is the basis for map-making across the world. Collectively, the network of these markers forms a geodetic datum. A geodetic datum allows for the precise location of the earth’s surface in measurements of latitude and longitude.
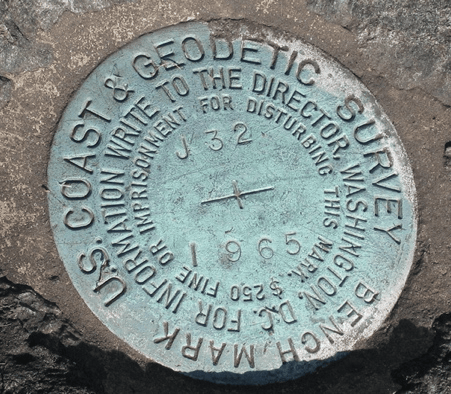
Chances are you’ve seen a National Geodetic Survey (NGS) survey marker or monument somewhere. These monuments are key survey points on the Earth’s surface. A network of these reference monuments that span the continent is referred to as a National Spatial Reference System (NSRS) and is the basis for standardized horizontal positions in North America.
This NSRS network was the basis for the North American Datum 1927 (NAD 27), which provided the foundation for tying specific locations on the earth with specific locations on the reference spheroid.
NAD 27 was established at Meade’s Range in Kansas, which was viewed as the geographic center of the contiguous United States. NAD 27 uses the Clarke Ellipsoid of 1866 as a reference ellipsoid and all monuments were based on measurements (direction, angle and distance) from this first marker in Kansas. Approximately 27,000 monuments in North America were used to form the NAD 27 datum.
Now there are over 250,000 of these monuments across the continent, and the network of their horizontal positions is the basis for the commonly used North American Datum 1983 (NAD 83). However, unlike NAD 27, NAD 83 uses the earth’s center-mass centric, GRS 80 reference ellipsoid for latitude, longitude, and some height data.
Vertical Datums
Vertical datums are used to accurately define height relative to a reference surface, which is typically defined by baseline mean sea level. There are essentially two vertical datum types:
- Tidal (defined by tidal variations over time at a specific location (e.g. mean sea level)
- These are localized and time-dependent
- These are localized and time-dependent
- Attempt to provide a uniform mean sea level height over a larger area
In North America, the North American Vertical Datum of 1988 (NADV 88) is the most commonly used vertical datum in the United States, but there are many types of vertical datums that are used worldwide. NADV 88 uses the fixed height of the tidal benchmark at Father Point in Quebec, Canada as the basis for this datum, and uses a leveling network across North America to affix mean sea level heights to this single point on the continent.
This discussion of monuments, distances, angles, and measurements describes how horizontal datums are created. These datums are highly accurate at providing latitude and longitude coordinates for a specific location on the earth’s surface, but less so at providing elevation data. Elevation measurements from horizontal datums are relative to the reference ellipsoid and do not truly reflect the elevation in terms of mean sea level. Thus, why we have both horizontal and vertical datums.
Geoid:
In the world of geodesy, as discussed above, the word geoid is a commonly used term.
But what is a geoid?
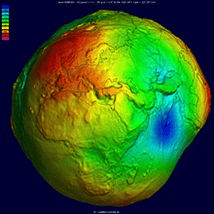
Think of it this way, a geoid is a model of the global mean sea level where there are no tides or winds to influence the water. As we know, the planet isn’t smooth, it is oblate in shape and lumpy and bumpy. These lumpy and bumpy areas have effects on the gravitation pull being exerted. Areas on the planet with continents and mountains have more mass and thus a slightly stronger gravitation pull than areas that are more devoid of mass, such as canyons and trenches. Therefore, gravity is not uniform around the earth. As a result, sea-level isn’t uniform either, even without the effects of tides, winds, or salinity. In fact, the variation can be as much as 100 meters in areas because of these differential gravitational forces.
A geoid models the shape of the earth based on where there is more or less localized density. For example, a mountain range is going to be much denser than a void such as a deep-sea trench. The result is an irregularly shaped equipotential surface that represents mean sea level (or the zero elevation around the planet).
It allows us to accurately measure the elevation of areas on the earth relative to mean sea level. This is easy enough to do in areas directly adjacent to the ocean but becomes much more difficult as you move further away. A geoid allows for the application of a standard mean sea level height, which can be measured to provide an orthometric height or elevation anywhere on the planet.
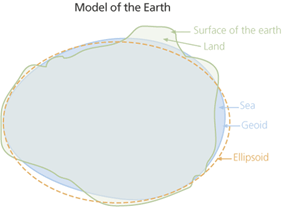
So, we have discussed reference ellipsoids (i.e., the overall shape and dimensions of our oblate spheroid-shaped planet), datums (the network of distance, direction, and angular data that ties the reference spheroid to locations on the earth’s surface), and geoids (the shape of the equipotential water on the planet as represented by forces of gravity).
You can see the relationship between a reference ellipsoid and a geoid, and how not all heights are the same.
In the world of geodesy there are different types of height, but the three most referenced and used are:

Orthometric Height
- Distance between a point on the earth’s surface and the geoid along a plumb line
- Representative of the North American Vertical Datum of 1988 (NADV88))
Ellipsoid Height
- The perpendicular distance from the ellipsoid height to the point on the earth’s surface
Geoid Height
- The perpendicular distance from the ellipsoid to the geoid.
As discussed, we have a highly accurate model of the shape of the earth (reference ellipsoid), the irregularities of the earth as represented by gravitational forces on equipotential water to provide the basis for mean sea level (geoid), and an understanding of how a network of related data points tie these data to the earth (datum). Now to describe specific locations on the planet, we need a system that ties these information sets together.
Geographic Coordinate Systems
That’s where Geographic Coordinate Systems (GCS) come in. A coordinate system is a reference system that can be used to represent locations on the earth within a common geographic framework. To do this, a geographic coordinate system uses a three-dimensional spherical surface (i.e. reference ellipsoid) to define locations on the earth. Areas on the earth’s surface are identified with angular measurements to identify locations based on geodetic models.
These imaginary lines are most often referred to as latitudinal and longitudinal lines. In a spherical system the horizontal (east-west lines), run parallel to each other and are spaced at equal distances. These are referred to as lines of latitude.
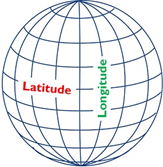
Lines of latitude represent the angular measurement from a point on the earth’s surface between the equatorial plane and the earth’s center. The equator represents the 0o latitude line, with the north pole being 90o and the south pole -90o.
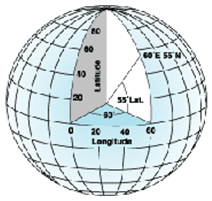
The vertical or north-south lines are the longitude lines. These lines are of equal meridians and originate at the north-south poles. Lines of longitude are also measured in degrees, but degrees relative to the Prime Meridian. These values range from 180o, when traveling to the west and -180o, to the east. The 0o longitude line is the Prime Meridian, which passes through Greenwich, England; however, it should be noted that some countries use other longitude lines as prime meridians.
Values along these lines are often referred to as X and Y and collectively, this grid of latitude and longitude lines is referred to as a graticule, with 0o, 0o being the geographic location where the equator and prime meridian intersect (off the western coast of Gabon, Africa). It is important to remember that even though lines of latitude run east/west or side to side, they measure the value of the Y axis. Reciprocally, lines of longitude run north/south or up and down, but measure the value of the X axis. Therefore, when asked for coordinates, X = longitude and Y = latitude.
There are many different models of the earth’s surface and as a result, many GCS are available. However, some of the most used GCS include:
- Geodetic Reference System 1980 (GRS 80)
- (which is the basis for NAD 83)
- World Geodetic System 1984 (WGS 84)
- (which is the system used by Global Positioning System (GPS) receivers)
The WGS 84 GCS is comprised of a reference ellipsoid, a standard coordinate system, altitude data, and geoid. WGS 84 is designed to be a uniform geographic coordinate system that is good for mapping global data, and as such is the reference system used by GPS receivers.
*A common misconception is that datums are geographic coordinate systems, such as WGS 84. Datums are critical components of GCS, but they are only one part of a GCS. All GCSs must include:
- An angular unit of measurement
- A prime meridian
- A datum
Coordinates such as latitude and longitude are good at knowing where something is located on the earth when paired with a prime meridian and datum, but they are not uniform units of measurement. For example, the distance between different meridians varies as you move north or south from the equator. The distance between meridians at the equator (0o latitude) is 111.3km, but only 55.8km at 60o latitude (Clarke 1866 spheroid).
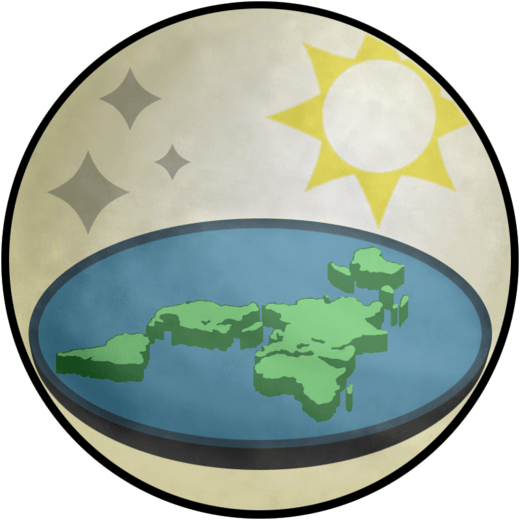
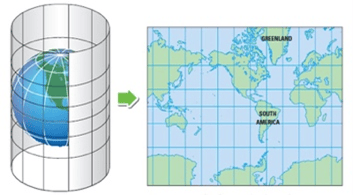
These discrepancies become problematic when trying to display data accurately on a flat surface. Now to accurately draw or represent where our data are located, we need to take data from the round earth and display it onto a flat 2D surface, such as a computer screen or paper map. Therein lies a fundamental problem; we cannot represent the round earth on a flat surface without distortion or deformation.
When it comes to understanding this issue, GIS professionals often use the analogy of peeling an orange. In this analogy the orange obviously represents our earth and peeling the orange is akin to attempting to create a flat map or image of a surface area. No matter how carefully we do it, we cannot take the round orange peel and press it to a flat surface without stretching, tearing, or distorting the peel.
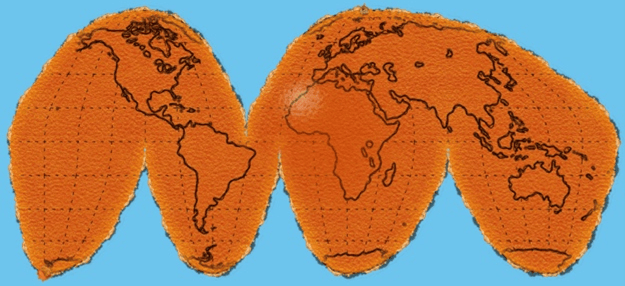
Map Projections
It’s just not possible to have a world map that is completely accurate when pressed flat, and that is where map projections come into play. Map projections are the mathematical techniques used to represent the earth’s round surface onto a flat surface. They are essentially GPCs that have been flattened.
There are many different map projections that describe how to accurately represent different parts of our orange peel (earth) on a flat surface. These are important, as they very accurately represent one geographic area of the globe but do so at an expense. As a result, all map projections distort at least one of the following:
- Angles between places
- Distances between places
- The area of places on a map
- The shape of countries or continents
There are many different map projections that cut the orange peel into different shapes and configurations. Some are almost perfect at representing the shape of area on the globe, or at preserving distance, or angular measurements, but do so at the expense of other variables. While some map projections compromise a little on everything but are not egregiously bad at any one variable.

There is not one perfect map projection for everything. It really comes down to the type and size of the map you are trying to create, and the variables which are most important to preserve. In fact, Esri’s ArcGIS currently supports many different types of map projections, but there are three main map projection family types:
- Conical Projections: The map is projected as if a large imaginary cone is placed over the earth. These are good at preserving the area of specific features at the sacrifice of the distortion of shapes, angles, and scale. These are best for land masses extending east to west orientation. Commonly used examples include:
- Albers Equal Area Conic Projection
- Lambert Conformal Conic Projection
- Cylindrical Projections: The map is projected as if it were projecting on the inside of a large cylinder. These projections are good at depicting the meridians and straight lines and maintain 90o angles as the intersection of latitude and longitude lines. These projections minimize the shape and scale of distortion in the central regions of the earth but become more distorted toward the poles. Commonly used examples include:
- Mercator Projection
- Transverse Mercator Projection
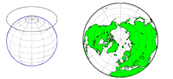
- Azimuthal (Planar) Projections: The map is projected as if the earth were being viewed from afar and were thus flat and on a plane. These projections preserve the direction from one point to other by maintaining arcs, which give azimuths of all data on the map correctly with regard to the center. These are best suited for thematic hemisphere maps and maps of polar regions. Commonly used examples include:
- Gnomonic Projection
- Stereographic Projection
- Orthographic Projection

Projected Coordinate Systems:
Projected Coordinate Systems (PCSs) provide the gridded framework for displaying data on a flat 2d surface. PCSs are always based upon GPCs, but unlike a GPC, the units of measurement (lengths, areas, and angles) are constant in a PCS. PCS use a grid of equally spaced horizontal and vertical lines. The horizontal lines are called the x-axis and the vertical lines are called the y-axis. Each position has an x and y value, which informs where that position is located on this grid, in reference to the center of the grid (origin x = 0 and y = 0).
Values on this grid are typically displayed in meters, and horizontal (x-axis) values that are above the x=0 origin are displayed in positive values, while values below the origin are displayed in negative values. The same is true for vertical values, with respect to being to the right or the left of the y origin (y = 0). Y values to the right of the origin are displayed with positive values and those to the left are displayed with negative values.

Esri’s ArcGIS supports hundreds and hundreds of PCSs, which allow users to accurately represent (map) and measure data from all over the world. Checking the GPCs and PCSs of your data in Esri’s ArcGIS application is discussed below.
ArcGIS
So, at this point we understand the fundamentals, but how do we check these parameters in ArcGIS? In ArcGIS Pro, any coordinate system can be checked in the Map Properties window. This applies to both the map layers as well as the map itself.
To check or modify the coordinate systems of the overall map:
- Right-click on Map and select Properties (Map Properties: Map - window)
- Select - Coordinate Systems
- There we see and can adjust the Current XY (horizontal) & Current Z (vertical) coordinate system that the map is using.

To check the coordinate system of a map layer:
- Right-click on Layer and select Properties (Layer Properties: - window)
- Select – Source -> Spatial Reference
- Projection
- WKID
- Linear Unit
- False Easting
- False Northing
- Central Meridian
- Standard Parallel 1
Geographic Coordinate System
- WKID
- Authority
- Angular Unit
- Prime Meridian
- Datum
- Spheroid
- Semimajor Axis
- Semiminor Axis
- Inverse Flattening
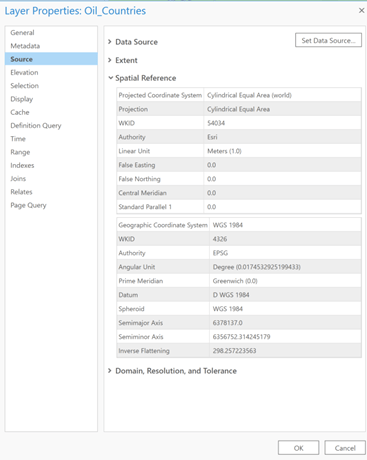
Many of these parameters have been discussed in this article (e.g. PCS, GCS, Prime Meridian, Datum, Spheroid, Semimajor and Semiminor axes, etc…). For reference, the WKID is the number identifying number for the PCS, defined by the Authority. Projected coordinates are often recorded in the linear unit, which is often meters. False easting and false northing are based upon the linear values applied to the X and Y coordinate origins. False northing is a linear value applied to the Y coordinates and false easting is applied to the origin of the X coordinate.
Modern ArcGIS software will re-project map layer data on-the-fly, meaning it can display data stored in one projection accurately in another projection. This works when a map is set to one projection and a layer/data with a different projection is added.
While ArcGIS can re-project data from one project onto a different projection so it can be displayed properly on a map, it is not altering the data. Therefore, when combining or integrating data in a GIS, the various themes (inputs) should share the same projection, datum, and ellipsoid to ensure that all of the features will be in accurate alignment.
Define Projection
Users can use the Define Projection tool in the ArcGIS Geoprocessing toolbox to define the projection for data that does not have a projection. This tool is found under:
- Geoprocessing ->
- Data Management Tools ->
- Projections and Transformations ->
- Define Projection
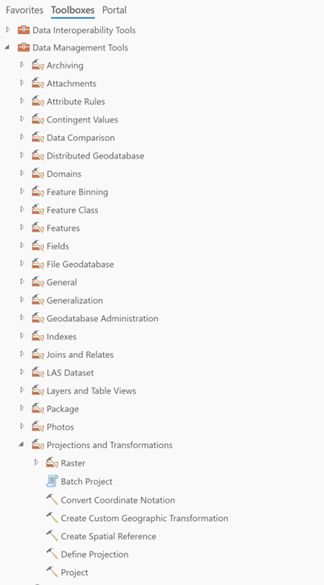
Change the Projection of your Data
Additionally, users can change the projection of their data to match the projection of their map or other data. The Project tool allows for these re-projections.
- Geoprocessing ->
- Data Management Tools ->
- Projections and Transformations ->
- Define Projection
With this tool, you define the Input Dataset or Feature Class, define where the new re-projected feature class will be stored, and the output coordinate systems. ArcGIS will indicate the geographic transformation taking place.
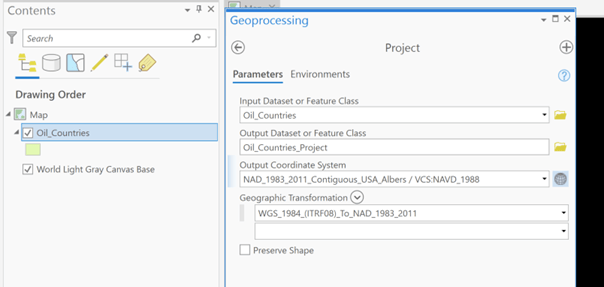
- Your data must have a GCS (Geographic Coordinate System), so it knows where on the earth it is located
- Your data does not need a PCS (Projected Coordinate System), but
- Your map must have a PCS
- A PCS is a flattened GSC that can more accurately be represented on a flat 2D surface.
- All PCSs have GCS built in.
References:
Anzlic Committee on Surveying and Mapping (ICSM). [No Date]. Fundamentals of Mapping – Datums. Available online: https://www.icsm.gov.au/education/fundamentals-mapping/datums#ellipsoid. Accessed March 19, 2020.
Earth Lab. 2020. Earth Data Analytics Online Certification: Lesson 4. GIS With R: Projected vs Geographic Coordinate Reference Systems. Available online at: https://www.earthdatascience.org/courses/earth-analytics/spatial-data-r/geographic-vs-projected-coordinate-reference-systems-UTM/. Accessed March 10, 2020.
ESRI. 2003. Mean Sea Level, GPS, and the Geoid. Available online at: https://www.esri.com/news/arcuser/0703/geoid1of3.html. Accessed March 16, 2020.
ESRI. 2009. Projection basics the GIS professional needs to know. Available online at: http://webhelp.esri.com/arcgisdesktop/9.3/index.cfm?TopicName=Projection_basics_the_GIS_professional_needs_to_know. Accessed March 15. 2020.
ESRI. 2016. What are geographic Coordinate Systems? Available online at: https://desktop.arcgis.com/en/arcmap/10.3/guide-books/map-projections/about-geographic-coordinate-systems.htm. Accessed March 10, 2020.
ESRI ArcMap. 2016. What are projected coordinate systems. Available online at: https://desktop.arcgis.com/en/arcmap/10.3/guide-books/map-projections/about-projected-coordinate-systems.htm. Accessed March 20, 2020
ESRI ArcMap. 2016. The geoid, ellipsoid, spheroid, and datum, and how they are related. Available online at: https://desktop.arcgis.com/en/arcmap/10.3/guide-books/map-projections/about-the-geoid-ellipsoid-spheroid-and-datum-and-h.htm. Accessed March 12, 2020.
ESRI. 2020. Geographic vs Projected Coordinate Systems. Available online at: https://www.esri.com/arcgis-blog/products/arcgis-pro/mapping/gcs_vs_pcs/. Accessed March 16, 2020.
ESRI. 2020. ArcGIS Blog: Earth Peel. Available online: https://www.esri.com/arcgis-blog/products/arcgis-pro/education/earth-peel/. Accessed March 12, 2020.
GIS Geography. 2015. Ellipsoid/Spheroid – Our Oblate Spheroid Planet Earth. Available online at: https://gisgeography.com/ellipsoid-oblate-spheroid-earth/. Accessed March 18, 2020
GIS Geography. 2020. Conic Projection Lambert, Albers and Polyconic. Available online at: https://gisgeography.com/conic-projection-lambert-albers-polyconic/. Accessed March 19, 2020.
Geospatial Users Group. 2019. Available online at: https://geospatialusersgroup.com/. Accessed March 15, 2020.
North American Atmospheric and Oceanic Administration (NOAA). 2020. What is the Geoid. Available online at: https://oceanservice.noaa.gov/facts/geoid.html. Accessed March 10, 2020.
National Geodetic Survey (NGS) National Oceanic and Atmospheric Administration (NOAA). 2017. Finding Survey Marks and Datasheets. Available online at: https://www.ngs.noaa.gov/datasheets/. Accessed March 18, 2020
National Geodetic Survey (NGS). 2018. North American Datum of 1927 (NAD 27). Available online at: https://www.ngs.noaa.gov/datums/horizontal/north-american-datum-1927.shtml. Accessed March 13, 2020.
Quora search. 2018. How many differences between longitude and latitude do we have? Available online at: https://www.quora.com/How-many-differences-between-longitude-and-latitude-do-we-have. Accesed March 10, 2020.
